The utilization report helps you make the best use of your team’s time. It shows how much of your team’s capacity is already planned and where there is still room to take on new work.
By looking at utilization across weeks, you can see where capacity is tight, where there is flexibility, and how workload is expected to develop in the near future. This way you can make better decisions when planning new projects or evaluating upcoming opportunities.
The utilization report is helpful for:
- Ensuring team members have enough work
- Scheduling new projects
- Reviewing workload and avoiding over-allocation
Accessing the report
Click on Reports from the left sidebar → Weekly Utilization
What the report shows
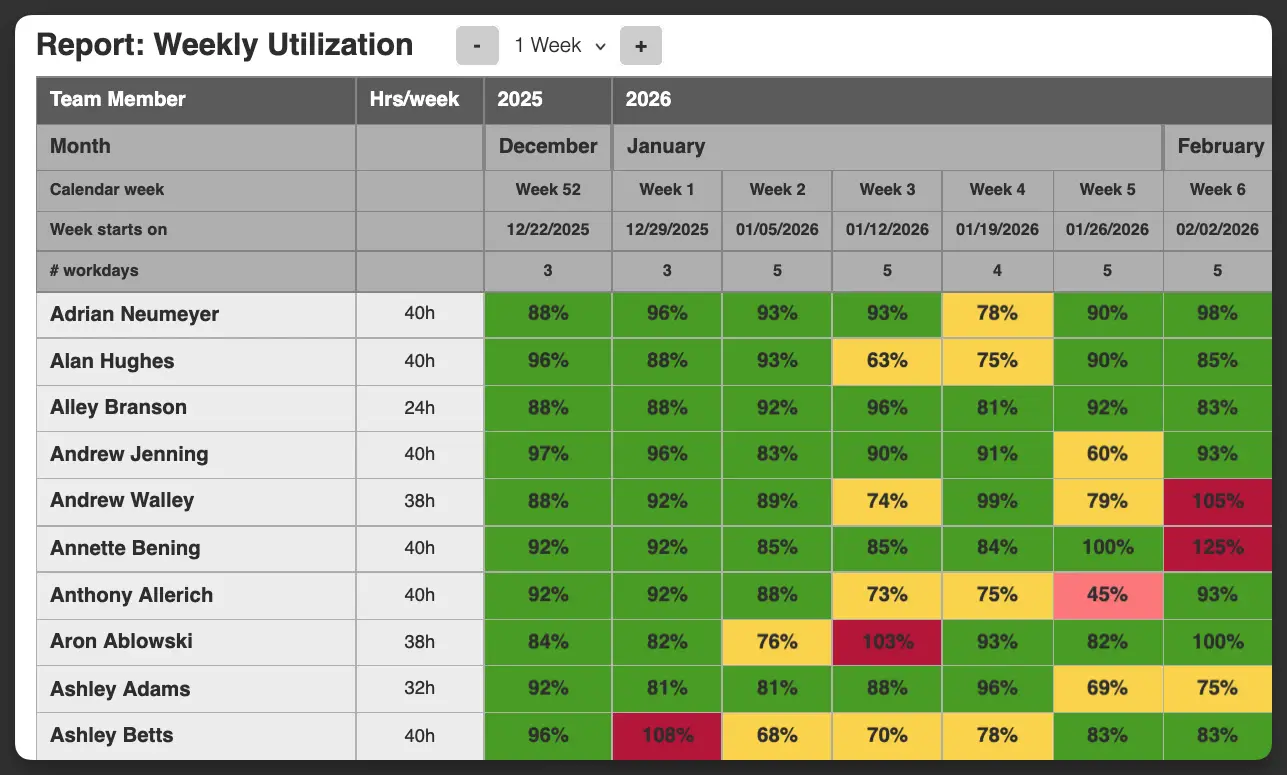
The report is organized as a table with team members listed in rows and weeks shown in columns. For each person, the report displays their weekly utilization percentage, based on planned hours compared to their available capacity.
The second column shows the person’s weekly working hours. At the top of the report, you can see the calendar header including calendar week, week start date and number of working days per week. This helps you understand which time period each utilization value refers to.
Each cell shows a utilization percentage and is color-coded according to your configured thresholds. This makes it easy to quickly spot weeks where someone is underutilized or overloaded.
Use the + / – buttons to jump to the following or past week.
How utilization is calculated
Utilization is calculated per person and per week by comparing scheduled work with available capacity. Scheduled work comes from the hours planned on projects in Caperity. Available capacity is based on the person’s configured working hours for that week and is automatically reduced if there is time off, such as vacation or public holidays. The planned workload is divided by the available capacity and shown as a percentage.
Example 1: John normally works 40 hours per week. In the first week of January, a public holiday reduces his available capacity to 32 hours. If 24 hours of work are planned for him in that week, his utilization is 24 ÷ 32 = 75%.
Example 2: Samantha works part-time, three days per week (Monday to Wednesday), for a total of 24 hours. In a given week, there is a public holiday on Friday, which does not affect her schedule. Her available capacity for that week therefore remains 24 hours. If she is allocated 20 hours of project work in that week, her utilization is 20 ÷ 24 ≈ 83%.
Read also:
Make the report reflect your targets
You can configure the Utilization Report to reflect your organization’s own targets. In practice, utilization is often monitored not only to avoid overload, but to ensure that available capacity is used in line with commercial goals.
By defining your own thresholds and colors, you decide which utilization levels represent a “good” number and where attention may be needed. This makes the report a practical tool for reviewing whether your team is operating within the range that supports your objectives.
How to configure the utilization report
You can control how utilization values are highlighted in the report by defining ranges and colors that match your planning approach.
Go to Manage Organization → Reporting and click Maintain. This opens a dialog where you define how different utilization levels should appear in the report.
Set up utilization ranges and assign a color to each range. These ranges control how workload is visually grouped, for example which utilization levels should appear in green.
For each range, you choose:
- the utilization values it should cover
- how the boundaries behave (for example,
- whether a value is included or excluded)
the color used to display that range
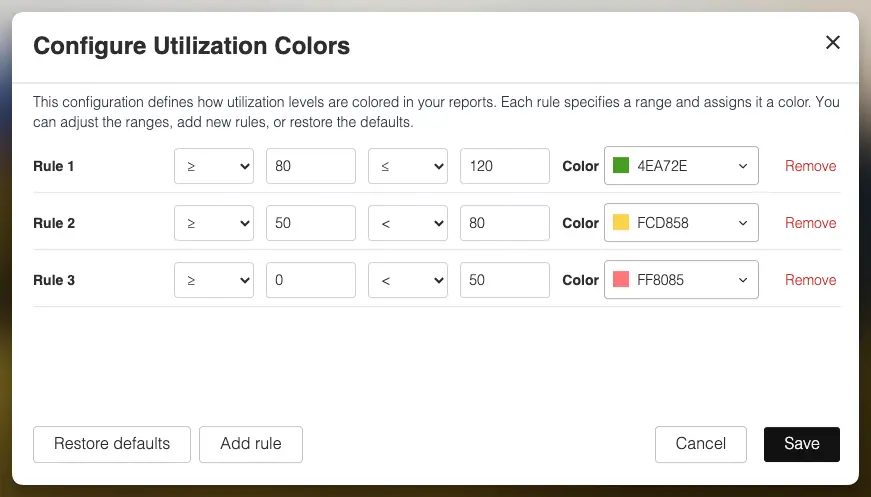
You can adjust these ranges at any time. The system prevents conflicting definitions. If a range is not covered, the report will still work, but values in that range will not be highlighted with a specific color.
To restore the original configuration, press Restore defaults.
Any changes are applied immediately and affect all utilization reports for your organization.
FAQ
How often is the report updated?
The report updates automatically as planning data changes. Any adjustments to project assignments or working hours are reflected immediately.
How are part-time employees handled?
Part-time schedules are fully respected. Utilization is calculated based on each person’s individual working hours, not a standard full-time assumption.
Do public holidays and time off affect utilization?
Yes. Available capacity is reduced if a public holiday or time off falls within a person’s working schedule. Utilization is always calculated against the remaining available hours.
Why does a utilization value have no color assigned?
If a utilization value falls into a range without a defined color, it will still be shown in the report but without a color highlight (grey only).