
Are you tired of running labor planning from a patchwork of Excel files?
You're probably experiencing this every month:
Scrambling for a date
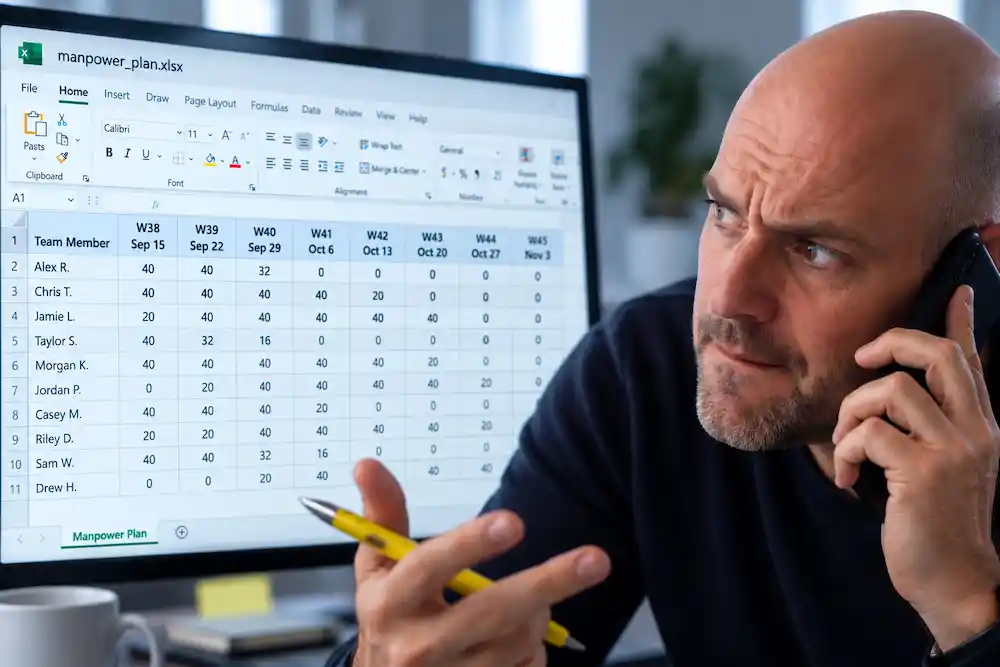
The deal is closed. Sales presses for a date: when can we ship? The hunt starts — finding the right people, with the right skills, who who can handle the extra work. You’re piecing it together from sheets that don’t agree and the latest word from the frontline. A few long days later, a plan exists. In your stomach it still feels like a thumb in the air.
Finding the margin eaters
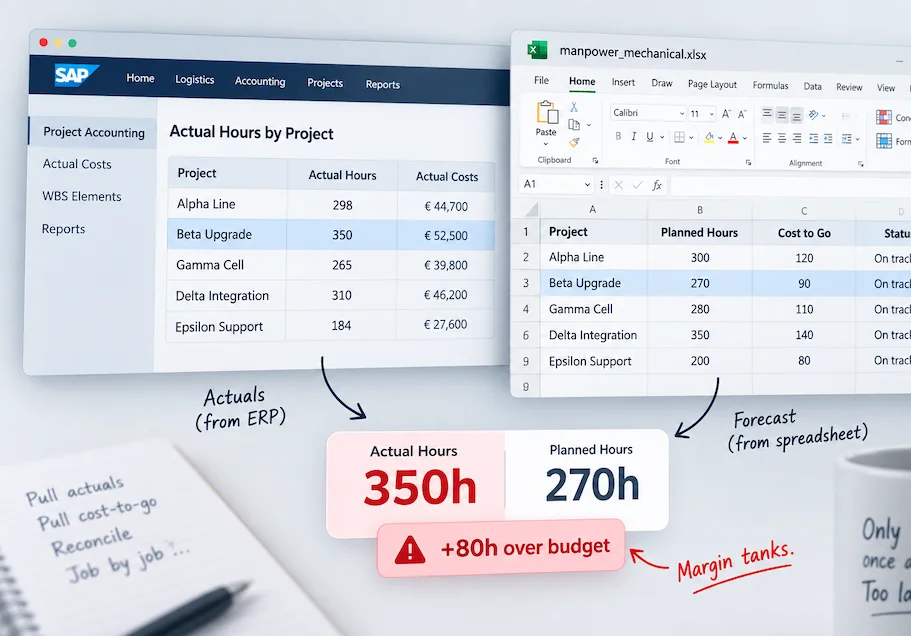
One job was supposed to take 270 hours this month. It took 350. You don’t see it while it’s happening, and the process to analyze it is cumbersome: You have to pull actuals out of the ERP. Cost-to-go out of the spreadsheet. Then reconcile the two by hand — job by job. Because it takes so long, only happens once a month, which is not enough. The options to absorb the cost are zero. Your margin tanks.
Forecasts always out of date
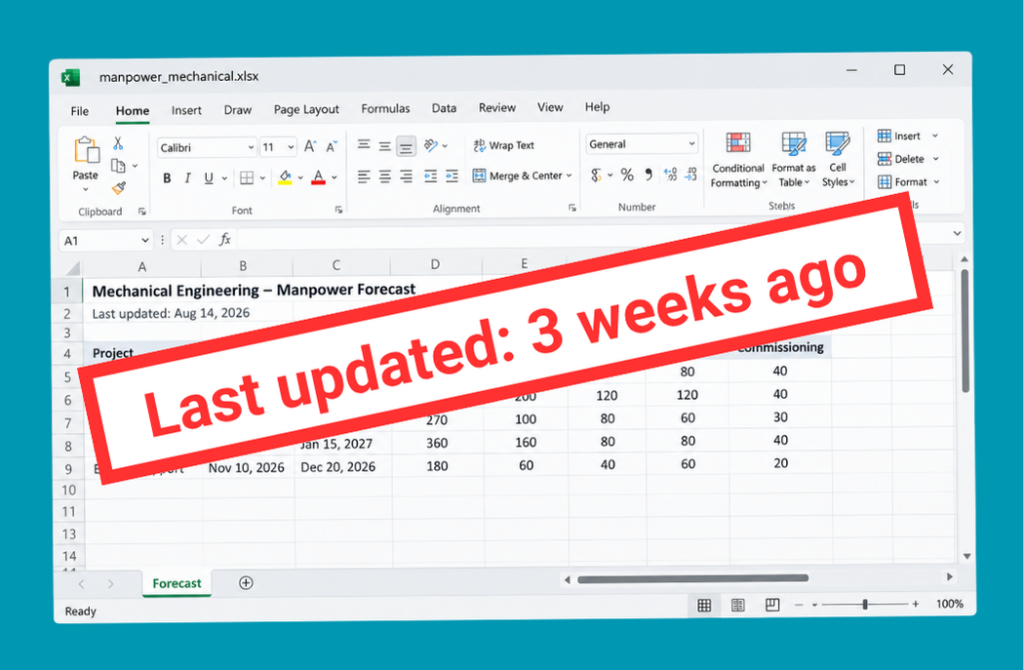
Projects change all the time. Dates move, scope changes and the hours needed go up or down. But when forecasts are maintained in a manpower spreadsheet, updating them can be a lot of manual work. So updates may only happen once a month. In between, the spreadsheet no longer reflects what project managers already know about their projects.
You’ve tried to solve it. 4 years later, still no solution.
You have downloaded every resource template from the web. But the structure never fit.
You have tried in-house apps to track capacity, always with the same conclusion: We are forcing a tool to do someting that it isn’t built for.
You have tried existing enterprise tools, only to conclude: “Nice, but why pay $20’000 per year when we only need 10% of the features?”
Just like you, we were stuck.
As a team of project managers, we wrestled with the same problem: forecasting projects by hand in Excel. We refused the company tool, because it took a simple job and made it more complex than it needed to be.
A little research later, we kept hearing the same message: “We have tried every tool. Nothing worked”
So we built the tool we were missing.
An easy way to resource many projects at once. Simple enough to use at 5pm, after a long day.
That’s how Caperity was born.
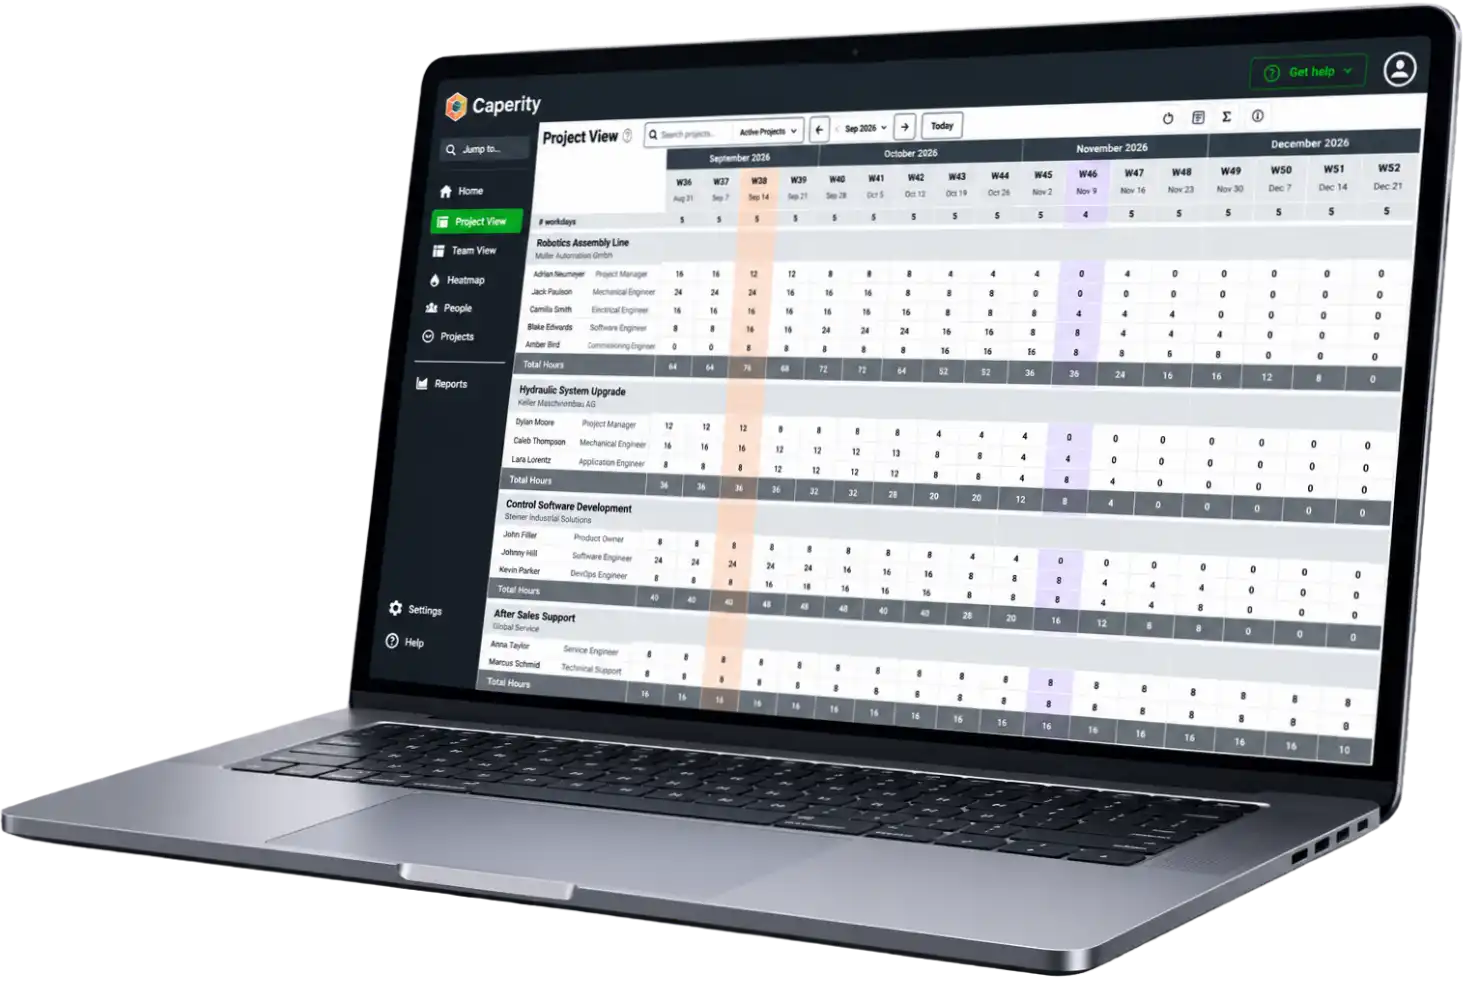
Caperity: Labor forecasting and project reporting in one place
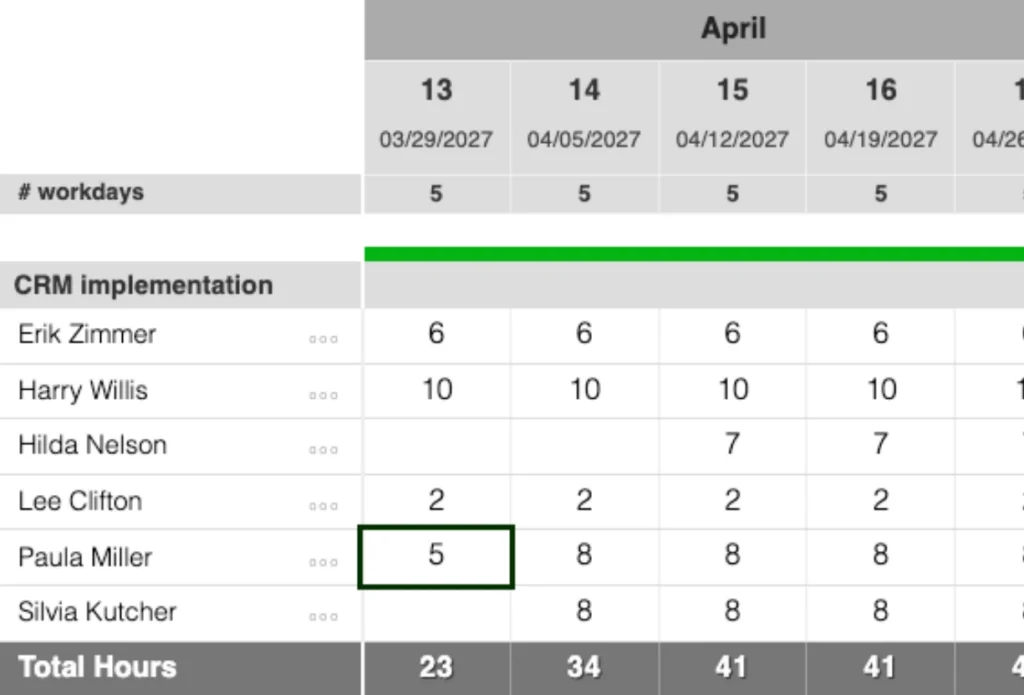
Caperity works like the typical manpower sheet. Just without the manual effort. This means means forecasts stay current and project performance is way easier to track. Many of our customers move off spreadsheets within a month.
- Easy forecasting for projects
- Team bandwidth instantly visible
- Cloud-based solution
- Plan up to 24 months ahead
Perfect for these industries

Custom manufacturing
Industrial automation and custom manufacturers use Caperity to forecast labor by department, track actuals against budget and get a clear picture across all projects.

Civil Engineering
Civil engineering firms use Caperity to plan confirmed and pipeline projects in one view, keep teams billable and share resources across offices, without separate spreadsheets per project.

IT
IT service providers use Caperity to manage staffing across multiple concurrent projects, tracking who’s allocated, who’s available and whether the team’s hours are on track.
Key Features
Project forecasting
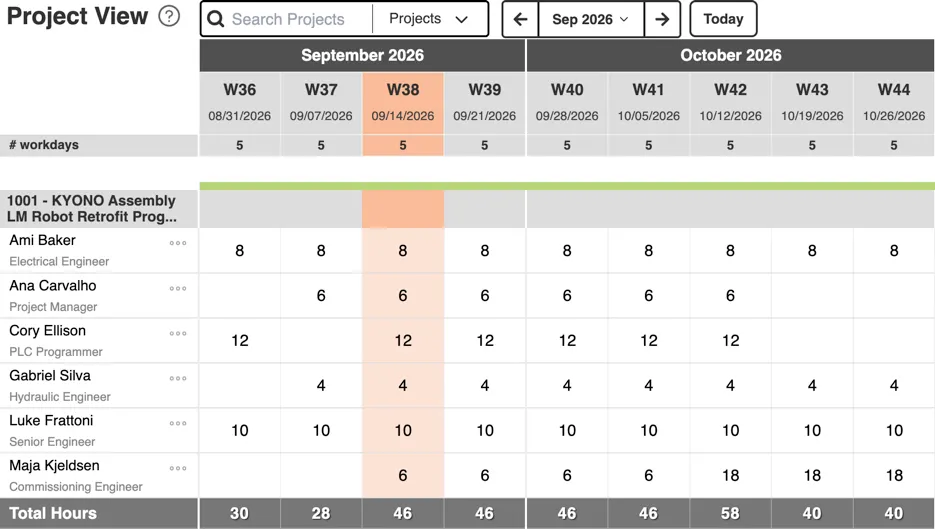
Every new project starts with a forecast. Department managers enter the estimated hours for their team in a simple planning view. Data is stored in the cloud and can be viewed instantly across the organization — with full visibility into project roles and skills across the team.
Real-time bandwidth visibility
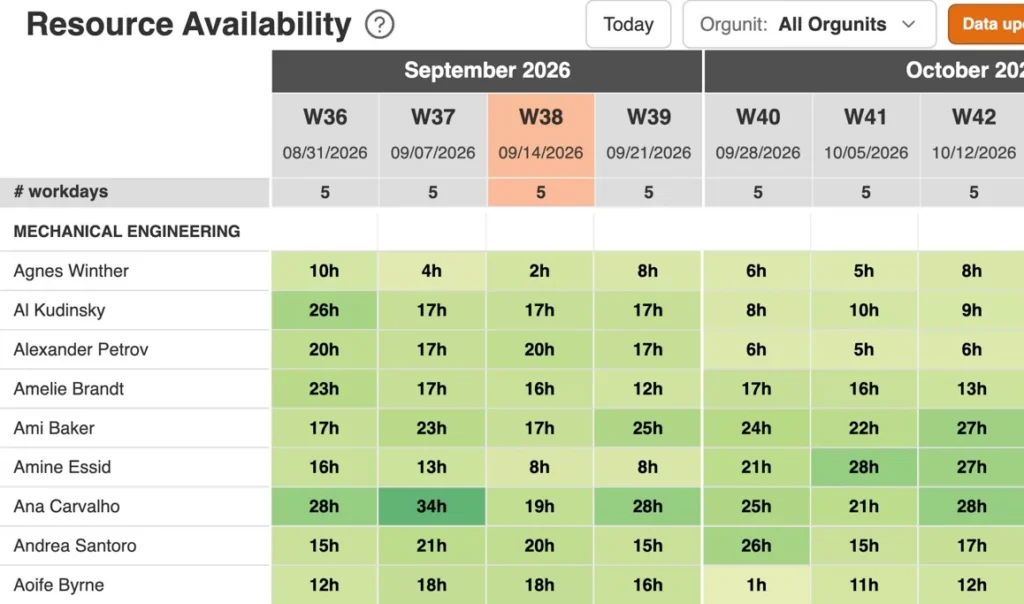
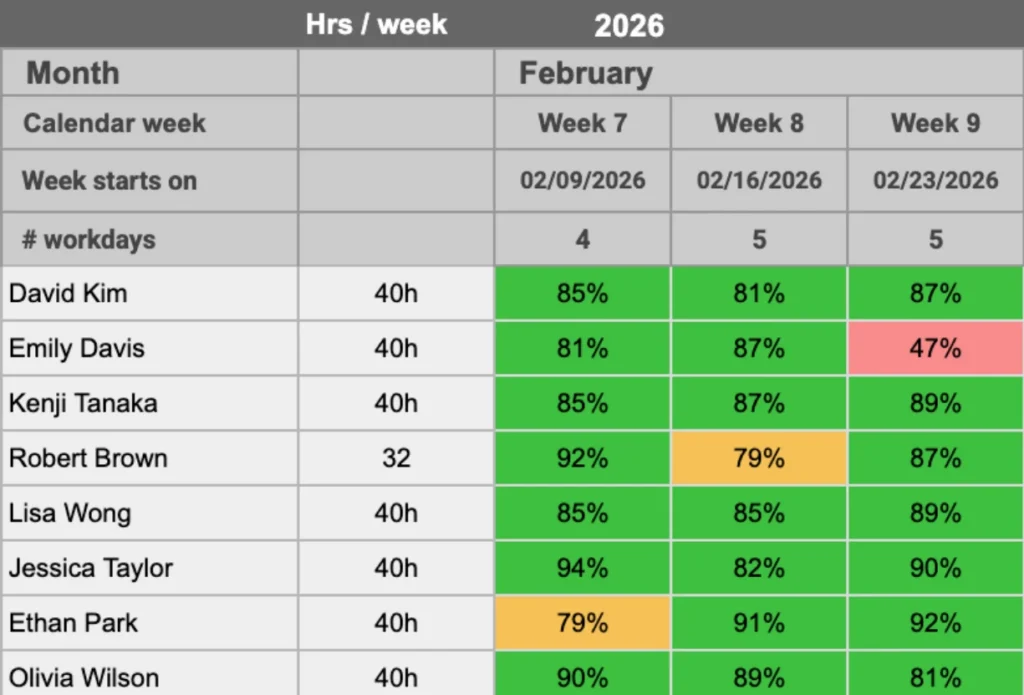
Instantly see where work can fit in — week by week, by person. Scheduled work, holidays and vacation are accounted for. Individual schedules and temporary work arrangements are also supported. It all works automatically, and manual rollups are a thing of the past.
Team-level access
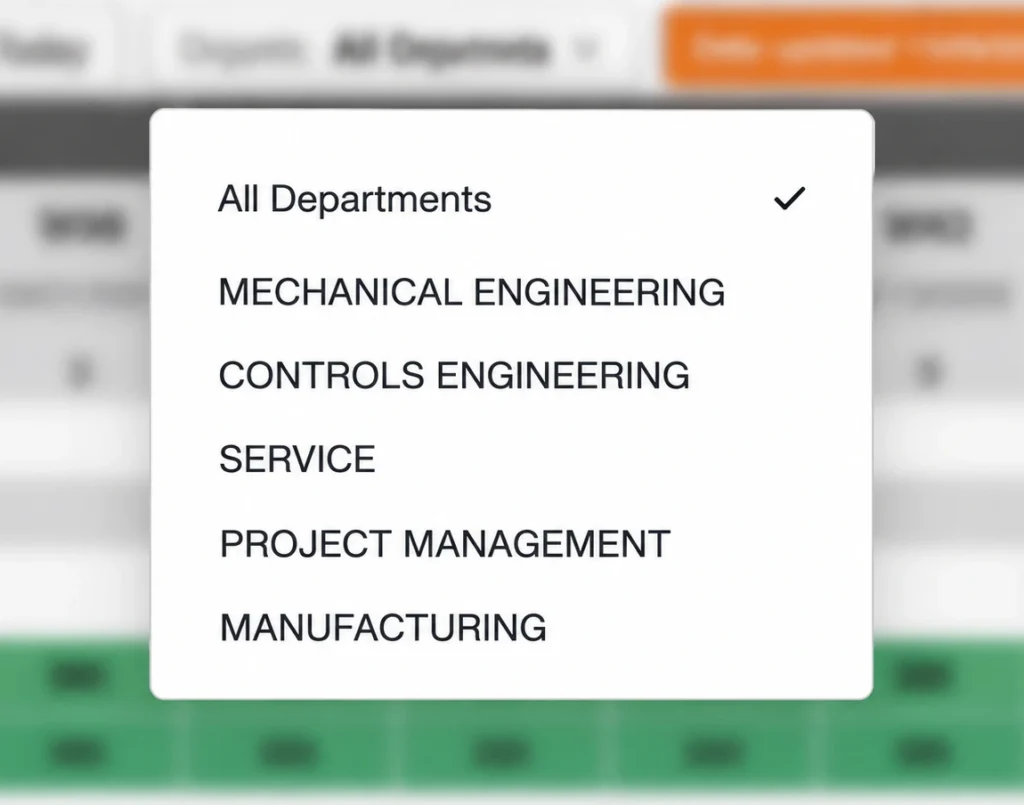
Each department manages their own data — hours, skills, time off. This means data stays accurate and controlled, while rolling up automatically into one organization-wide view.
Forecast vs. Actuals
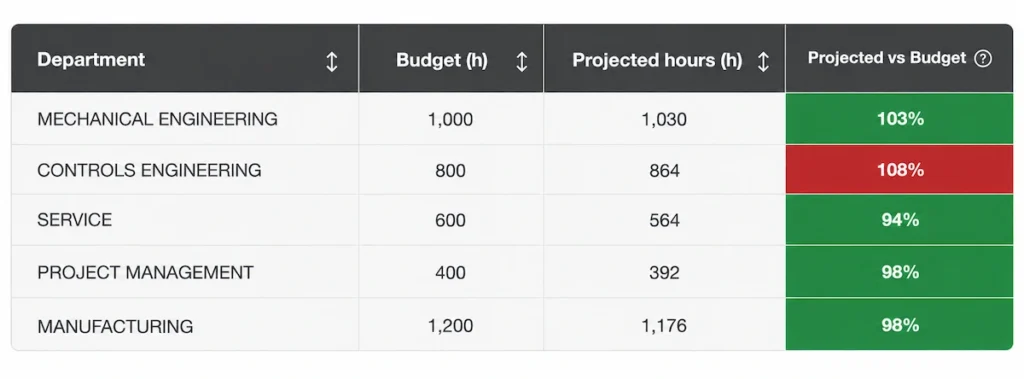
Are your projects tracking to budget or quietly going over? At the end of each period, actual hours can be imported from your timesheet system via CSV. Caperity immediately shows the variance against planned budgets — by project and by department.
Reporting built in
See your data from every angle. Utilization by person, hours by project or by person, capacity vs. demand, budget vs. actuals — weekly or monthly, by department, by role, by project. Export to Excel whenever you need to share outside the platform.
And if you need something specific — just reach out. We build new reports based on what our customers need.
What customers are saying
The simplest way to plan work and manage capacity.
Join the managers who’ve traded clunky spreadsheets
for a planning tool that’s actually fun to use.
Discover Caperity in 3 Minutes
Frequently Asked Questions
What is Caperity?
Caperity is a cloud-based resource capacity planning tool for project-driven teams. It gives delivery leads and project managers a clear view of team availability and workload across multiple projects — without the complexity of enterprise tools or the limitations of a spreadsheet.
Who is Caperity for?
Caperity is for project-driven teams managing multiple concurrent projects across a medium to long planning horizon. It’s used by delivery leads, project managers and PMOs across IT delivery, consulting engineering and creative services.
How is Caperity different from other tools?
Most resource planning tools assume a fixed allocation per period — for example 20 hours per week on a project, spread evenly across time. This does not reflect reality, where plans change frequently. In Caperity, you can enter hours freely per week. This makes it easier to adjust allocations as plans change.
Do we need to install any software?
No. Caperity runs in the cloud. You access it via your browser.
How can we import our data into Caperity?
Existing data can be easily migrated using our Excel templates. Projects, team members and project hours can all be imported and mapped to the correct person and project. There’s no need to bring over your full project history—just the remaining and future hours you need for planning. We’ll support you throughout the migration process.