Forecasting Team Capacity Across the Project Portfolio (FTE Template Included)
Managing a project portfolio means living with uncertainty. You know what’s under contract and you have a sense of what’s in the pipeline. But can your team actually cover the next twelve to twenty-four months?
An FTE by month template helps you find out. It maps out how many people you’ll need by role and over a long horizon.
This article explains how such a template works and includes a free template you can download and adapt for your team.
Key Takeaways
Plan by role category over a 12–24 month horizon, before you know the individuals.
Weight prospective work by win probability to get a realistic demand forecast.
Separate contracted backlog from pipeline, and treat them differently.
Use this view alongside individual-level planning, not instead of it.
What Is FTE Planning by Month?
FTE stands for full-time equivalent. One FTE means one person working full time and half an FTE means half their time.
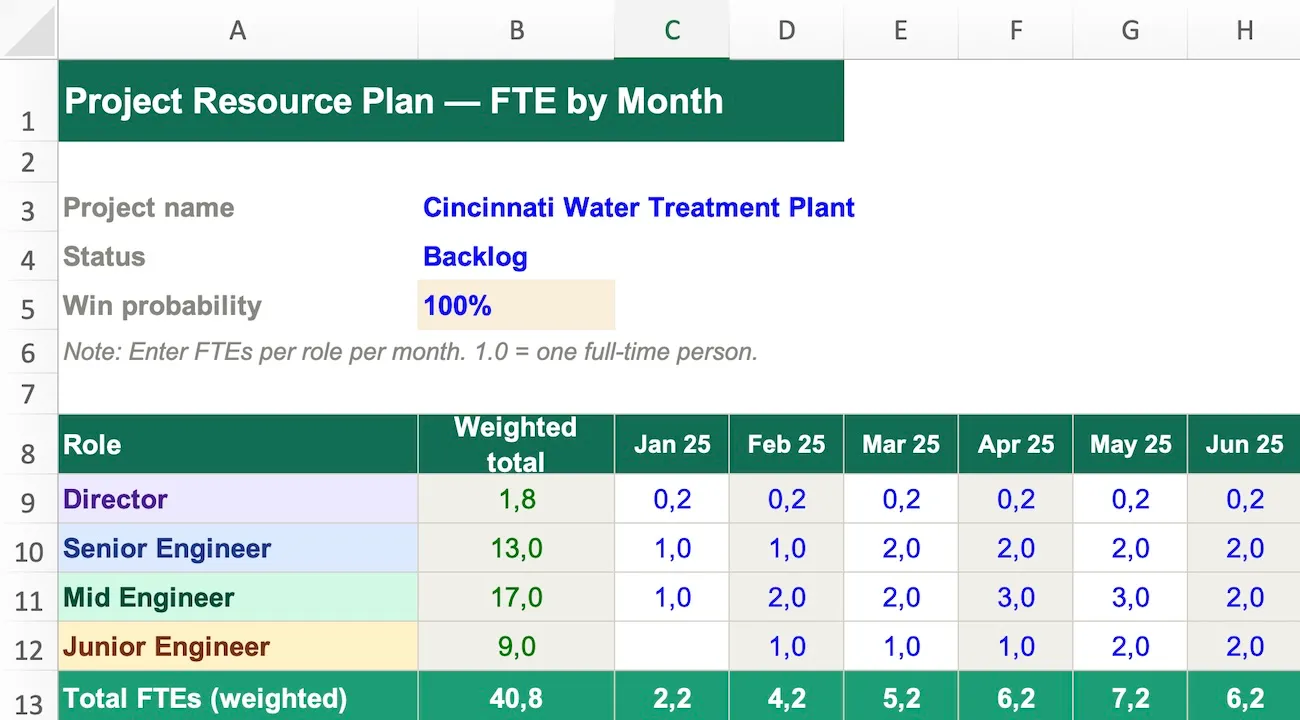
FTE planning by month means forecasting how many FTEs you need for each project — broken down by role across a monthly timeline.
A typical view looks like this:
Role category
Jan
Feb
Mar
Apr
May
Jun
Director
0.2
0.2
0.2
0.2
0.1
0.1
Senior Engineer
1.0
1.5
2.0
2.0
1.5
1.0
Mid Engineer
2.0
2.0
3.0
3.0
2.0
1.0
Junior Engineer
1.0
1.0
1.0
2.0
2.0
1.0
Complete this overview for each project — contracted and prospective — and then aggregate across all projects to see your total FTE demand by role and month.
Then you compare that to how many people you actually have in each category.
That gap tells you whether to hire or pursue new work, or shift people between projects.
When to Use FTE Category Planning (Instead of Individual Planning)
There are two levels at which you can plan resources. Both matter but thhey serve different purposes:
FTE category planning — by role, not by name — is the right tool when:
The planning horizon is 12 to 24 months out
Individuals haven’t been assigned to projects yet
The focus is on portfolio-level demand across all projects
Some of the work in the forecast hasn’t been won yet
Individual-level planning — named people, specific hours — is the right tool when:
The window is the next three to six months
Projects are confirmed and staffed
The question is whether specific people are overloaded
Project managers need to track and update their own allocation
Think of it as two lenses on the same problem. The FTE category view gives the big picture. The individual view gives the operational detail.
A senior project lead at a civil engineering firm described it this way: he runs an FTE-by-month view covering two years across all projects and prospects, using four role categories — director, senior engineer, mid engineer, and junior engineer. Then separately, for the next six months, he switches to individual-level planning where named people are assigned to specific projects.
The two-year view tells him whether a team of fifty can cover the work that’s coming. The six-month view tells him whether Michael is overloaded.
Both views are needed. Neither replaces the other.
How to Factor In Backlog vs Pipeline
This is where most templates fall short — and where your planning becomes genuinely useful.
Not all future work is equally certain. Some projects are under contract. Others are still in the pipeline, with varying likelihood of being won.
If you plan all your prospective work as if it’s confirmed, your FTE demand will be wildly overstated. If you ignore it entirely, you’ll be blindsided by capacity gaps when work does come in.
The solution is probability weighting.
Contracted backlog: projects already won and committed to delivering. Count these at 100% of their FTE requirement.
Pipeline prospects: projects you’re pursuing but haven’t won yet. Apply a win probability factor to scale down their FTE contribution.
Here’s how the maths works:
A project requires 3 senior engineers per month. You estimate a 50% chance of winning it. Its weighted FTE contribution is 1.5 senior engineers per month.
Another project requires 10 people but you have only a 30% chance. Its weighted contribution is 3 FTEs — not 10.
Across ten pipeline projects, this approach produces a realistic aggregate demand figure rather than a best-case or worst-case one. The portfolio effect smooths things out — some you’ll win, some you won’t.
The formula is simple:
Weighted FTE = Required FTE × Win probability
In the template, you enter the win probability for each project. Contracted backlog gets 100%. Prospects get whatever your honest estimate is — 30%, 50%, 70%, depending on how far along you are in the pursuit.
The template handles the weighting automatically.
Download: FTE by Month Template
The template includes:
Role category rows — pre-set as director, senior, mid, and junior (fully customisable)
A 24-month column structure
One section per project, with a win probability field
Automatic probability weighting for prospective work
A backlog vs prospect flag for each project
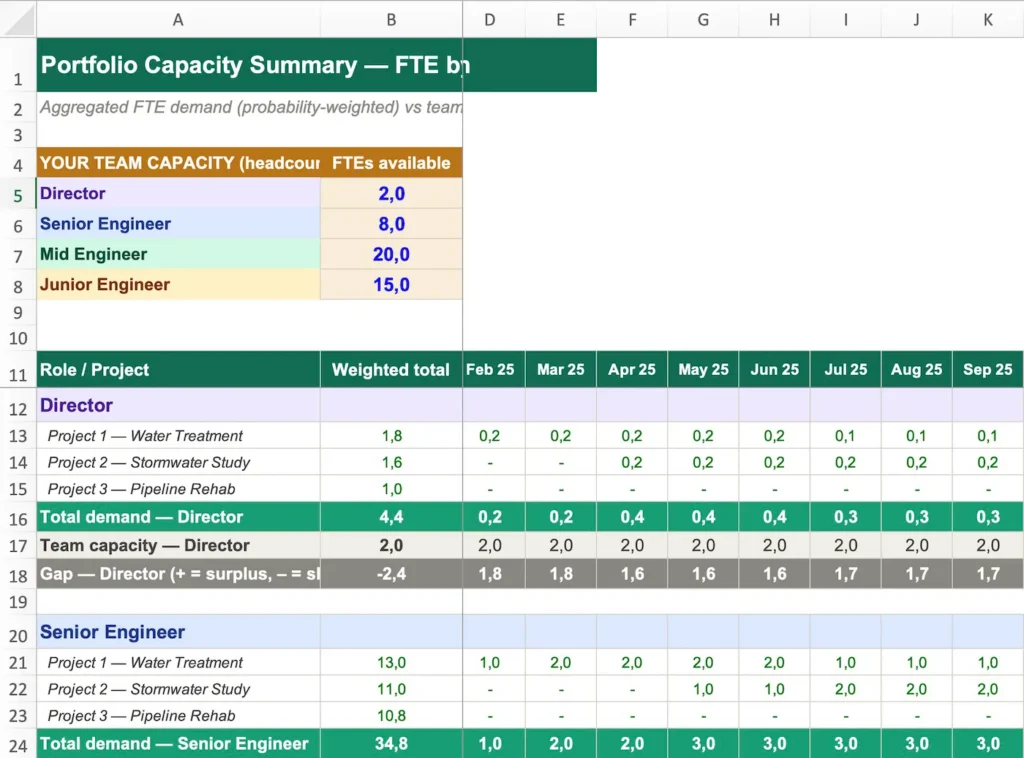
A summary tab that aggregates FTE demand across all projects by role, with a comparison to your current team headcount
Pre-filled example data so you can see immediately how it’s intended to work
Start with everything on your radar — confirmed work and pipeline. Include projects you’re actively pursuing, even if the probability of winning is low. The weighting will account for uncertainty.
Step 2: Set the win probability for each
Contracted backlog: 100%.
For prospects, be honest. Use your historical win rate as a reference point, adjusted for the specifics of each pursuit.
Step 3: Assign FTEs by role and month
For each project, fill in how many FTEs per role you expect to need, month by month. At this stage you’re not naming individuals — you’re estimating the type and volume of resource required.
Consider the shape of the project over time. Most projects ramp up, peak, and then wind down. Capture that curve rather than using a flat average.
Step 4: Review the summary
The summary tab shows your total weighted FTE demand by role, each month, across all projects — compared to your current team headcount.
A positive gap means you have more demand than capacity. You’ll need to hire, borrow from another team or office, or be selective about which work you pursue.
A negative gap means you have spare capacity. That’s useful information too — it shapes your business development priorities.
Step 5: Update monthly
The forecast is only useful if it’s current. As projects are won or lost, and as new opportunities emerge, update the template. This takes around fifteen to thirty minutes once the initial setup is done.
The Next Step: Planning at the Individual Level
The FTE by month template is a portfolio-level forecasting tool. It shows that there will be a gap of two senior engineers in Q3. It does not show which two people to move or which projects are most at risk.
For that, the next step is individual-level planning — named people, specific projects, actual hours over the next three to six months. That’s where the operational decisions happen.
A spreadsheet can handle this, but it has a blind spot: it doesn’t account for when people are actually available. Holidays, planned leave and part-time schedules all affect real capacity.
This is where a tool like Caperity helps, because holidays and working schedules are factored in automatically, so the capacity numbers reflect reality.
Adrian Neumeyer has spent over a decade in project delivery, leading high-stakes strategic IT initiatives for major global engineering firms like Bosch and HILTI. He is also the Founder of Caperity, focused on giving managers a simple, practical solution for project capacity planning.