Are you trying to figure out if your team can actually handle the work coming in?
This article shows you how to manage demand vs. capacity so you can make clear decisions and justify them to management.
What is Capacity?
Capacity is the amount of work a team can realistically handle within a specific period. It is based on several factors:
The number of people on your team
Their availability
Their skills
Skills matter because people aren’t interchangeable.Planned work has to be matched to the people who have the necessary skills.
Capacity and demand are usually tracked in FTE, person days (PD) or hours.
What is Demand?
Demand is all the work the organization expects the team to handle—confirmed projects, upcoming work, active quotes, and deals still in discussion.
Why manage project demand and capacity?
There is always more work than the team can realistically deliver. The goal of capacity vs. demand analysis is to spot bottlenecks early and plan projects so they actually fit — without overloading the team. It also makes sure your team is properly utilized.
What you need to get started
With the right inputs, comparing demand and capacity is quite simple. Here is what you need:
List of projects (by status, likelihood)
Estimated effort per project
Probability factors
Team members, capacity, by skill/role
Holidays, closing days and planned time off
1. List all projects (confirmed and unconfirmed)
Start with your full pipeline and not just confirmed work.
Include:
Ongoing projects
Confirmed projects
Approved but not started work
Quotes in progress and deals under discussion
The key is to separate them by likelihood. Not everything will happen, but it still creates pressure on your planning.
2. Estimated effort per project
Each project needs an estimate of how much work it will require.
This gives you:
A complete view of total demand
A way to compare projects against available capacity
A basis for realistic planning decisions
Break it down by role/skill and distribute it over time (weeks or months)
For example:
Project A: 0.3 FTE Project Manager in March, 0.3 FTE in April etc.
This allows you to directly match demand with capacity and make decisions based on planned workload.
3. Probability factors
Not every project in your pipeline should be treated the same.
Assign a rough probability to each, for example:
100% → confirmed
80% → highly likely
50% → possible
This allows you to weight demand realistically instead of planning as if everything will happen. Some projects won’t materialize, and overestimating demand leads to underutilized teams and missed opportunities.
4. Team members and their capacity
You need a clear view of:
Who is available
How much time they have
What they can actually do
Capacity needs to be viewed by role or skill and not just as a total number.
5. Holidays, closing days and planned time off
Capacity is only “full” on paper, but not in reality.
You need to account for:
Public holidays
Company-wide closures
Planned vacations
Known absences
This directly reduces available capacity—and often exactly at the wrong time.
Putting demand and capacity side by side
Now map out capacity and demand for the coming months. This enables you to see what fits in the pipeline and where the gaps are.
Capacity by role (in FTE):
Role
January
February
March
April
Project Manager
5.0
5.0
5.0
5.0
Business Analyst
8.0
8.0
8.0
8.0
Cloud Engineer
3.0
3.0
3.0
4.0
Developer
6.0
6.0
6.0
6.0
Comments:
The table shows capacity in FTE by role. A value of 5 in the first row means 5 full-time project managers.
You may notice an increase in Cloud Engineer capacity in April, reflecting a planned new hire. Hiring and attrition should always be reflected in your long-term capacity planning!
Now let’s build the demand.
For each project, we define the estimated effort— in FTE, person-days or hours. This reflects the expected workload based on the agreed scope.
Project A: Demand
(Numbers are in FTE)
Project
Role
January
February
March
April
Project A
Project Manager
0.30
0.30
0.30
0.30
Business Analyst
0.30
0.30
0.10
0.10
Cloud Engineer
0.10
0.10
0.20
0.20
Developer
0.20
0.20
0.40
0.40
Repeat this step for each project.
For unconfirmed projects, scale the estimated effort using the probability factor.
Example: Let’s say Project C has a 70% likelihood, and the Developer effort for March is estimated at 0.5 FTE, then demand needs to be adjusted as: 0.5 × 0.7 = 0.35 FTE.
Now aggregate demand across all projects and compare it with monthly capacity:
Role
Type
January
February
March
April
Project Manager
Capacity
5.0
5.0
5.0
5.0
Demand
4.8
4.8
5.2
5.2
Gap
0.2
0.2
-0.2
-0.2
Business Analyst
Capacity
8.0
8.0
8.0
8.0
Demand
8.2
8.0
7.6
7.8
Gap
-0.2
0.0
0.4
0.2
Cloud Engineer
Capacity
3.0
3.0
3.0
4.0
Demand
3.2
3.2
3.0
3.4
Gap
-0.2
-0.2
0.0
0.6
Developer
Capacity
6.0
6.0
6.0
6.0
Demand
6.0
6.0
6.2
6.0
Gap
0.0
0.0
-0.2
0.0
This helps us see the gaps:
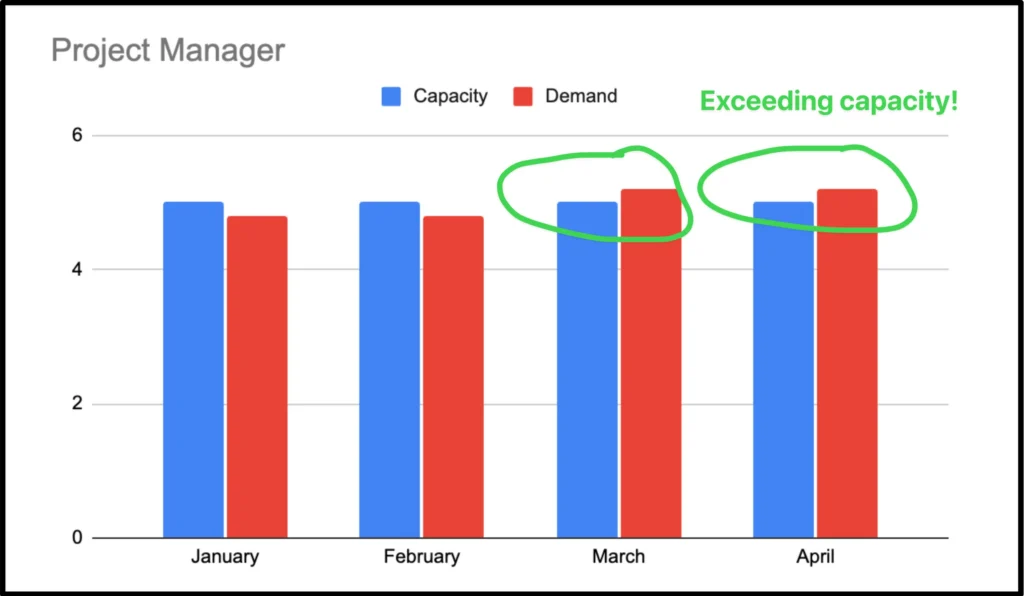
Project Managers: We have a consistent, small buffer through March (0.2 FTE), but we get slightly overbooked in April (-0.2 FTE). A small task may need to be shifted from April to earlier in the year or held until May.
Business Analysts: We start January slightly overloaded (-0.2 FTE), but this quickly clears. The team provides a healthy capacity buffer in March (0.4 FTE gap), which could be a good window to schedule flexible, lower-priority work.
Developers: This role is stable through February (fully utilized), but we are overbooked in March and April (a -0.2 FTE gap each month). We need to push work out of Q2 immediately or find a temporary capacity boost.
Cloud Engineers: We have an immediate bottleneck in January and February (-0.2 FTE), meaning projects scheduled for those months are already at risk and may need to be descaled or deferred. Crucially, the planned new hire in April gives us a significant buffer (0.6 FTE gap), resolving the bottleneck for Q2 and providing great capacity for new projects.
Visualizing capacity and demand
Once you’ve mapped out demand and capacity, visualization makes the situation clear.
Instead of reading through tables, you can immediately see where things don’t fit and where the bottlenecks are.
Example: Project Manager Capacity vs Demand over Time
This chart shows demand vs. capacity for Project Managers. Wherever demand exceeds capacity, the plan doesn’t hold—and something has to give.
Because we are dealing with three dimensions — role, time, and demand vs. capacity — we can’t fit everything into a single chart without making it messy. Create separate charts per role to keep it readable and make bottlenecks visible.
How to handle gaps in capacity versus demand?
Once you’ve identified gaps between demand and capacity, the goal is to adjust the plan so it’s actually doable.
Here are practical ways to handle it in a project environment:
When demand exceeds capacity
Delay projects or phases: Push start dates or extend timelines to move work out of overloaded periods.
Adjust phase spacing: Increase the gap between phases to avoid peak overlaps. For example, discovery can happen in February, while execution starts in April if March is already overloaded.
Re-sequence work: Change the order of projects so critical roles are not overloaded at the same time.
Reduce scope: Cut or simplify deliverables to lower the required effort.
Shift work across roles: Reassign tasks where skills overlap or where flexibility exists. This is not always possible but should be considered.
Add external capacity: Bring in freelancers or contractors to cover short-term peaks.
When capacity exceeds demand
Pull work forward: Start projects earlier to use available capacity.
Advance upcoming phases: Bring forward later project phases where possible.
Take on additional work: Use the available capacity to accept new projects from the pipeline.
Invest in improvements: Use the time for internal work (process improvements, documentation, training).
Summary
Managing demand vs. capacity turns your pipeline into something you can actually plan.
By breaking work down project by project, estimating effort by role, and mapping it over time, you can see what the team can deliver.
Adding probability factors and realistic availability ensures that this view reflects how work actually happens and not just how it looks on paper.
Putting demand and capacity side by side makes constraints visible. Bottlenecks become clear, decisions become easier, and trade-offs can be made early.
FAQ
What is capacity? What is demand?
Capacity is the amount of work a team can complete, taking into account team size, people’s availability and their skills.
Demand is the amount of work an organization wants to be done. These are most commonly planned orders or projects.
Why is it helpful to compare capacity and demand?
Showing capacity and demand side by side reveals the gap between what the team can deliver and what the organization expects. This makes it possible to schedule work in periods where it is actually achievable and avoid overloading people.
Does capacity include vacation, holidays and other time off?
Yes. Capacity needs to reflect the actual time people are available, which means subtracting vacation, holidays and other planned time off. Otherwise capacity would be inflated and lead to unrealistic plans.
Adrian Neumeyer has spent over a decade in project delivery, leading high-stakes strategic IT initiatives for major global engineering firms like Bosch and HILTI. He is also the Founder of Caperity, focused on giving managers a simple, practical solution for project capacity planning.